Note: Strikethrough text (i.e., this) may be used below to indicate items that students are to skip in the current (2022) iteration of the course but that I do not want to have to keep track of separately from this webpage.
This first set of questions does not require you to do any data analysis yourself.
[1]The basic framework of survival analysis is also known by a variety of other names. What alternative name is especially common in social science?
[1]What does the term censoring mean in the context of survival analysis?
[2]Wisconsin Longitudinal Study respondents were born circa 1939. This means that many respondents have died, and many respondents are still alive. If you are interested in estimating the relationship between, say, education and mortality, why would it be a problem to omit from your analysis respondents who are still alive?
Say you are doing survival analysis of married couples in which your “failure event” is divorce.
[1]What is one time-varying explanatory variable that you might study in this analysis? Provide a reason why you think this variable might be related to the increasing/decreasing the risk of divorce.
[1]What is one explanatory variable that you might study in this analysis that is not time-varying? Provide a reason why you think this variable might be related to the increasing/decreasing the risk of divorce.
[3]Survival analysis data are organized into spells. First, explain what a spell is. Then, explain the different ways a spell can end by reference to the following example: a survival analysis for data on persons who have been released from prison. For the example, the failure event is re-arrest; one of your explanatory variables is having a stable job; and individuals in your study are no longer observed if they move out of state.
[1]The Barkley marathons are a trail-running race that involves competitors trying to complete 5 20-mile loops in 72 hours, and it is so difficult that usually no one finishes. In 2022: 40 runners started the race; 30 completed loop 1; 6 completed loop 2; 5 completed loop 3; and 1 completed loop 4. What was the hazard for dropping out of the race on loop 2? Explain how you arrived at your answer.
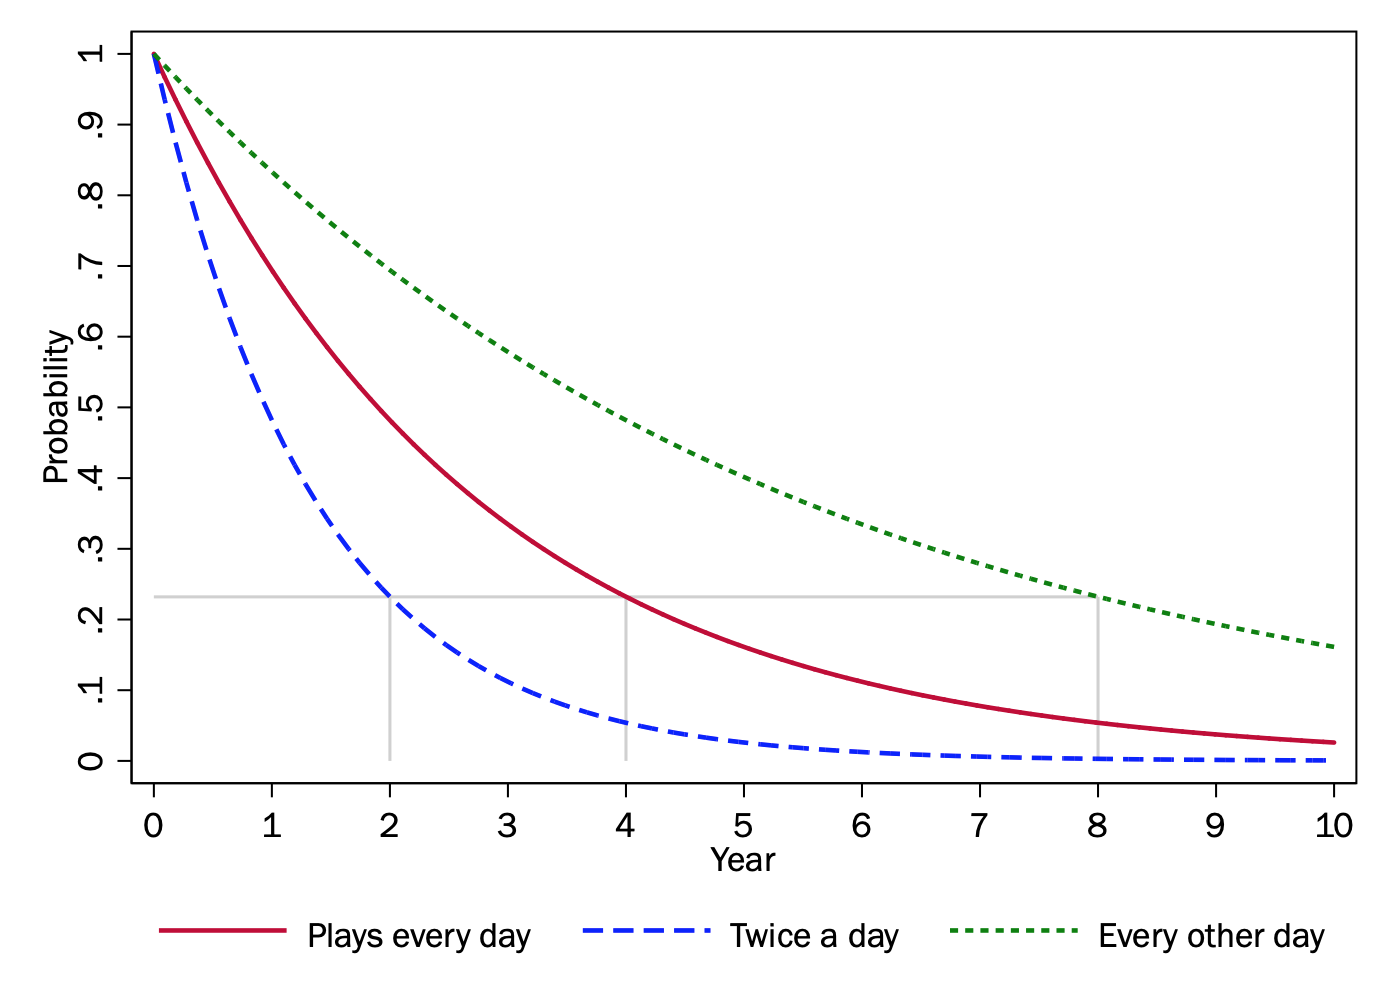
[2]If somebody buys a “Daily 3” ticket every day, their hazard of winning is constant; that is, their hazard function is a flat line. If our failure event is winning-for-the-first-time, it might seem reasonable to guess that the survival curve would also be linear, but instead, as shown for example here, the slope of the curve decreases with time. Explain, in no more than 5 sentences, and as if you were talking to a new graduate student who had not yet taken our course, why.
[1]The most popular regression model in survival analysis, Cox regression, does not actually model the specific time in which failure events occur at all. What does it model instead?
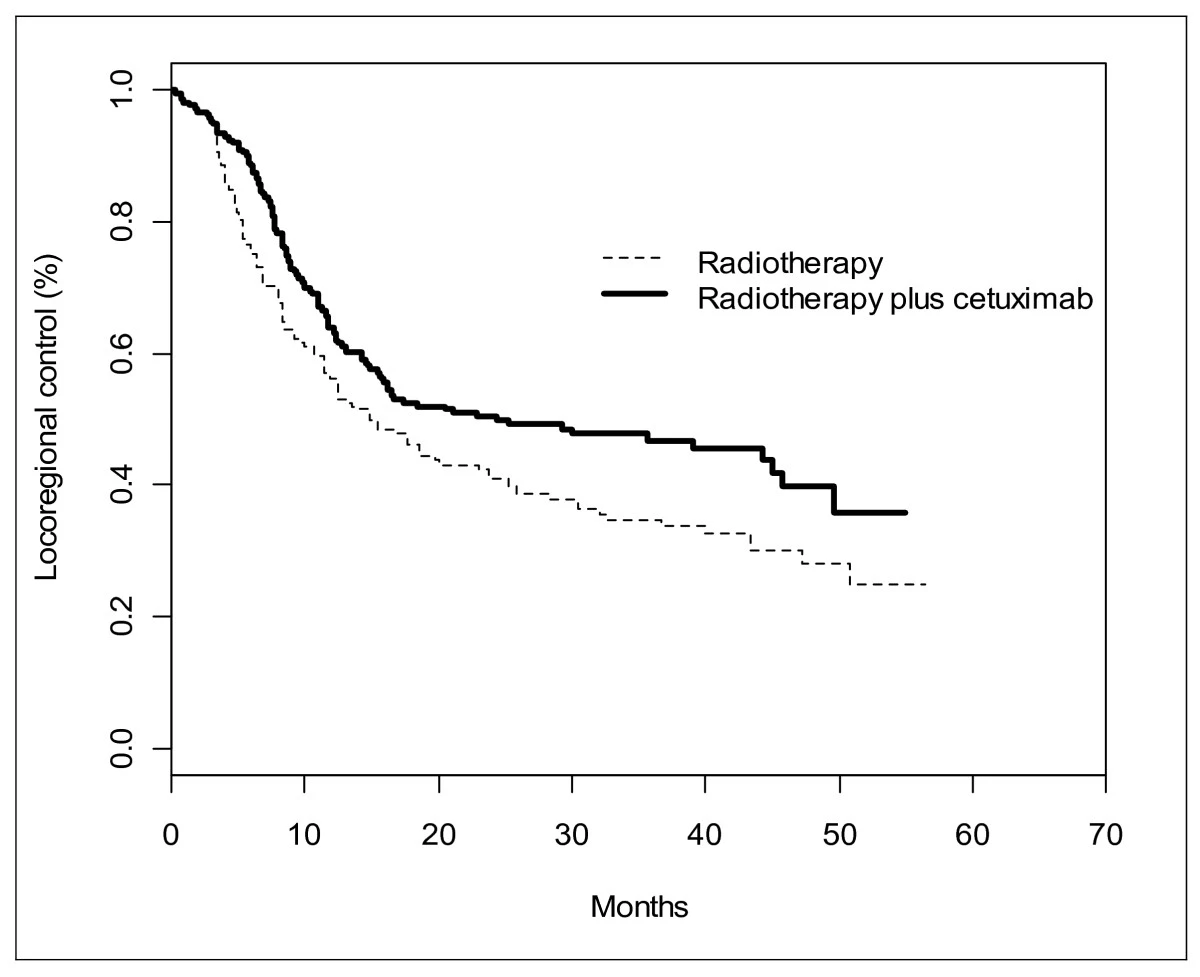
[1]Here is graph with a couple of Kaplan-Meier curves from cancer research that I found in a haphazard Google search. Locoregional control is the prevention of cancer spreading to other parts of the body; it is a good thing. “Radiotherapy” and “radiotherapy plus cetuxmiab” are treatment options. From the graph, which treatment appears more successful for maintaining locoregional control: radiotherapy or radiotherapy plus cetuximab? How can you tell?
The remaining items are premised on you doing some data analysis yourself.
For the events part of this assignment, we will be using the Austin Animal Center data. The file is available here. This file is already set up for doing survival analysis in Stata (that is, you do not have to use the \(\texttt{stset}\) command).
Select a pair of variables whose relationship, together, with time-to-adoption you are going to consider. Hereafter I will refer to these as ``your chosen variables.’’ Do not choose a pair of variables that, to your knowledge, anyone else is also analyzing (as a pair; sharing one of the two is fine). Do not select a pair of variables that I have analyzed in the notes (dog/cat and color; dog/cat and stray/surrendered).
You may look at your chosen variables separately for dogs or for cats, or the comparison of dogs vs. cats may be one of your two variables.
[3]In 2-3 sentences, state your chosen variables and why you think it might be interesting to look at these two variables with respect to time to adoption.
[2]If not already a binary variable, create new variables based on each your chosen variables that divide each into two groups if this is not already done. Cross tabulate each binary variable with the \(\texttt{adopted}\) variable. Use the \(\texttt{row}\) or \(\texttt{col}\) option so that we can see what proportion in each group are adopted. Interpret the results.
Draw a nice-looking Kaplan-Meier curve showing survival among the four groups defined by the combination of your two binary variables [\(\texttt{sts graph, by()}\)]. (That is, if your binary variables were rabbit/lizard and big/small, your four groups would be big rabbit, small rabit, big lizard, small lizard.)
[1]Include the graph in your assignment (i.e., paste it in).
[1]Pick a time on the curve and describe what the graph says about the difference in observed mortality at that time.
[3]Fit a Cox model with your chosen variables as regressors. Interpret the hazard ratios for your chosen variables. Are the results consistent with what you were expecting or not?
[2]Using \(\texttt{stcurve}\), estimate the hazard function implied by the results of your Cox model. Paste the graph into your assignment. Is the hazard function constant, increasing, decreasing, or non-monotonic? Explain what this means.